Statistical Power
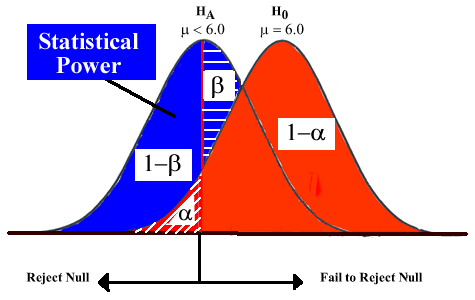
Statistical power is the probability of rejecting a false null hypothesis. It is represented on the graph below by 1-b. Remember that the area under the curve of any graph represents relative frequency or probability. So, we can calculate the statistical power of a test by determining the probability our sample mean falling into the solid blue (1-b) area under the curve.
We can either learn how to calculate statistical power, or can move ahead to a discussion of the factors that influence statistical power.
| Click here to see how to calculate statistical power. | |
| Click here for factors that affect statistical power. |