Practice Exercise
Graph Means
In order to help us with our interpretation, we graph the means of each cell. For this study, we are concerned with both test difficulty and time of testing.
|
Time of Testing (Factor B) |
|||
|
Test Difficulty (Factor A) |
9:00 am
|
12:00 pm
|
3:00 pm
|
|
Difficult
|
M=2.75
|
M=6.25
|
M=10.00
|
|
Easy
|
M=10.00
|
M=7.50
|
M=3.50
|
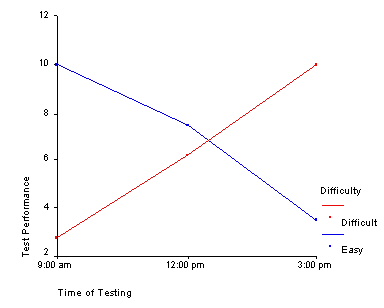
As we can see from the graph, the effects are clearly not parallel. The level of performance on the exam is a function of both the difficulty level of the exam and the time of day of the test. Our last step is interpretation.
|
Click here to return to summary of calculations: |
|
| Click here to go to the end of the tutorial: |